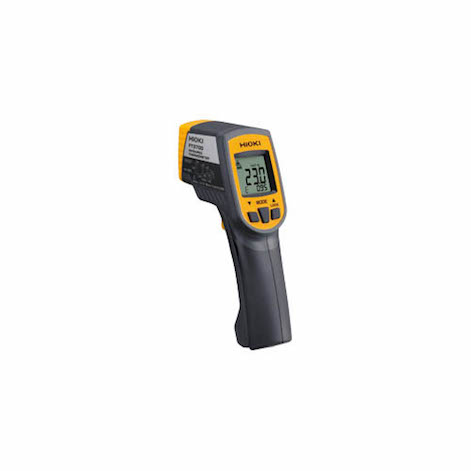
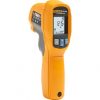
HIOKI FT3700-20/FT3701-20 Infrared Thermometer
PRODUCT FEATURES:
- Pistol design with easy-to-see display
- A full menu of basic measuring functions
- Easily test in difficult locations, moving objects or where there is danger of electric shock
DOWNLOAD PDF FILE
Related Products
-
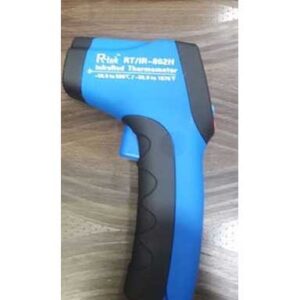
Infra-Red RT-802H Thermo Meter
PRODUCT FEATURES :
- Temp Range ; – 50c to 580c
- Emmisivity ; Adjusdable
- Distance spot; B : 1
- Warranty ; 1 Year.
DOWNLOAD PDF FILE
-
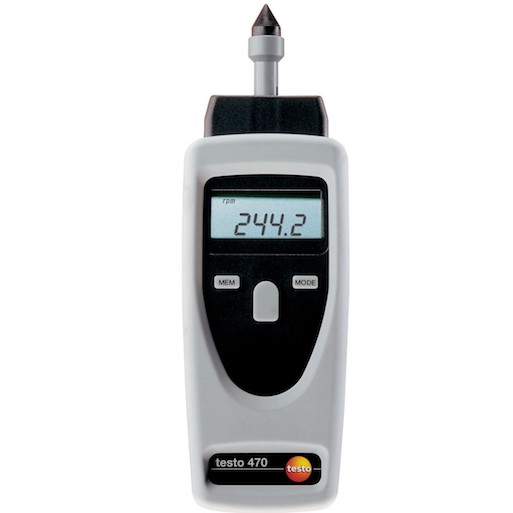
testo 470 Two in One Contact & Non Contact Tachometer
PRODUCT FEATURES:
- Can be used for rpm, speed & length
- Storage of Max./Min. value over a measurement
- Comes with a kit including accessories for correct measurement
DOWNLOAD PDF FILE
-
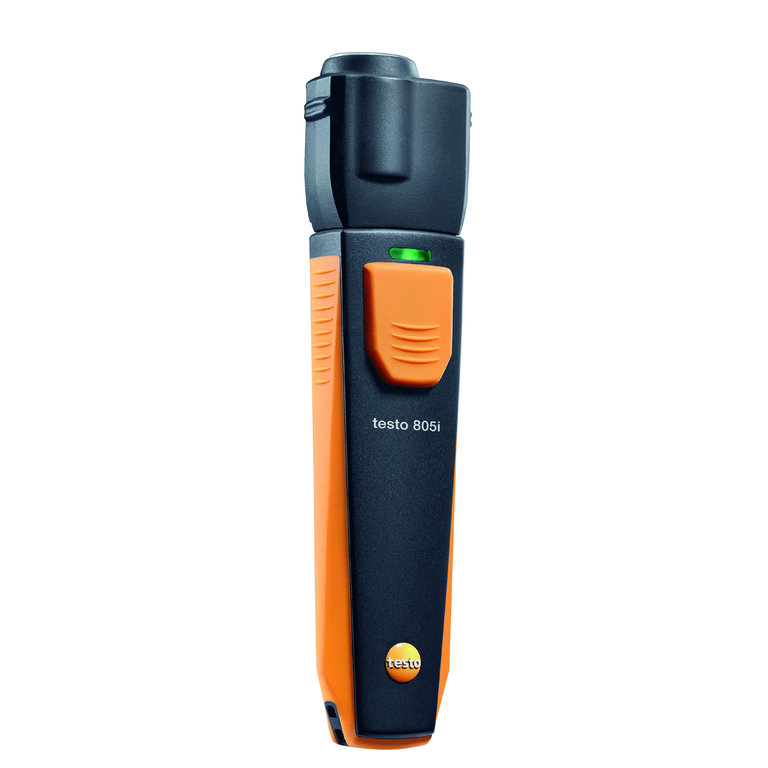
Testo 805i Smart Infrared Thermometer
PRODUCT FEATURES:
- Non-contact IR measurement of Surface temperature in the range of -30C to+250C
- Easy image documentation incl.measurement values and measurement spot marking with 8-point laser circle
- Wireless connection to a smartphone or tablet via Bluetooth Free App
- All measurement data in graph or tabular format; can be directly sent as PDF or Excel files.
PDF DOWNLOAD FILES
-
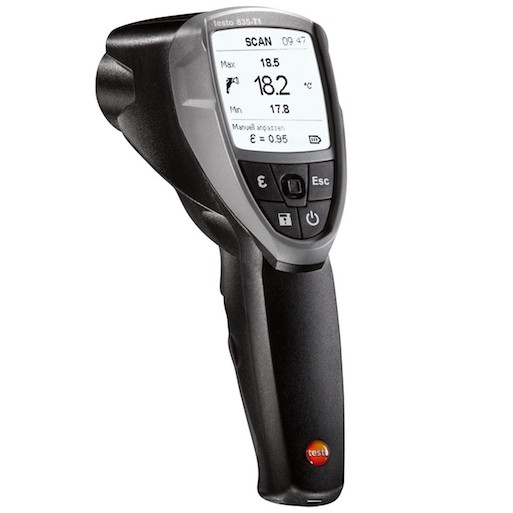
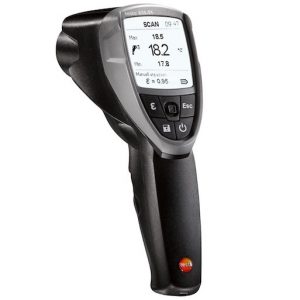
Testo 835 T1 /T2/H1 IR Thermometer
PRODUCT FEATURES:
- Measuring range up to 1500C
- 50:1 optics with 4-point laser marking
- Integrated emissivity table
- Integrated memory and USB -data transfer
- Connection of external TC-probe
- Automatic detection of emissivity with the help of external probe
- Variant available with humidity measurement.
DOWNLOAD PDF FILE
-
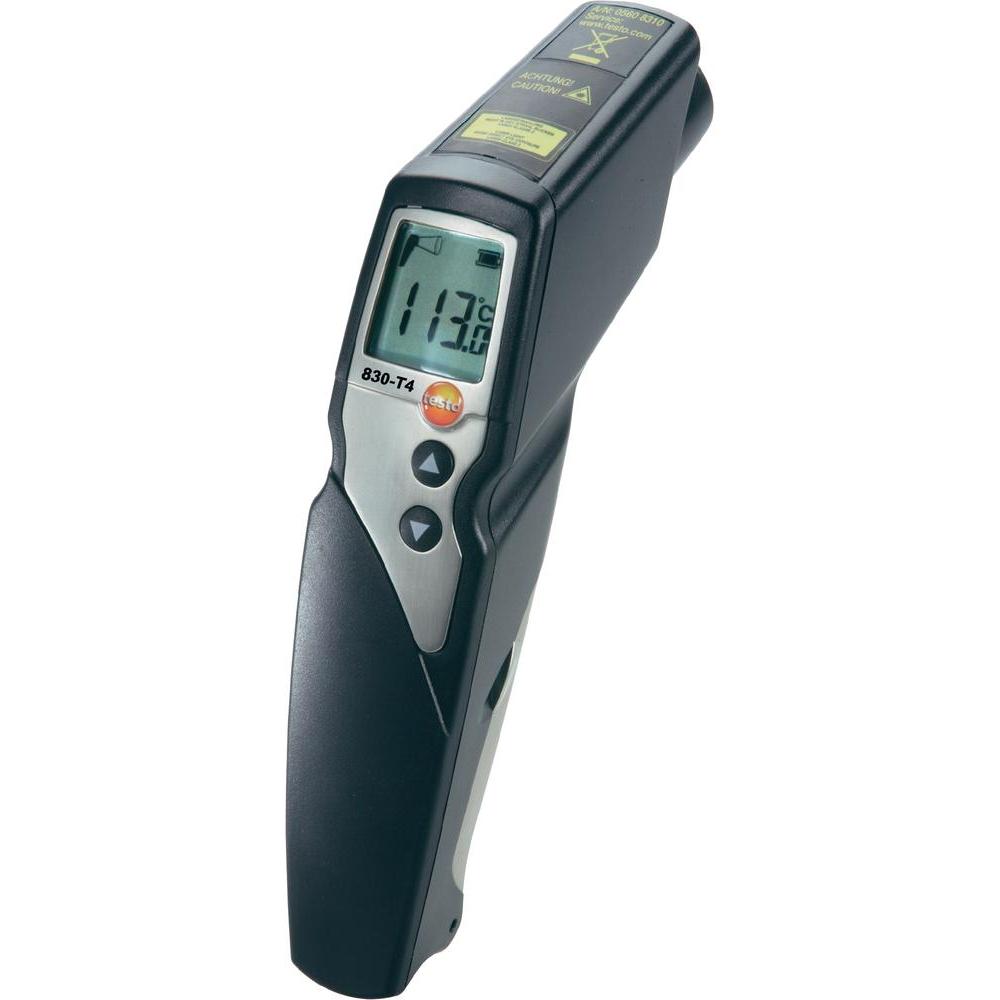
Testo 830 Series Fast IR Thermometer (Contact cum Non-Contact )
PRODUCT FEATURES:
- Emissivity adjustable from 0.1 to 1
- From – 13C to 400C
- 830T2, T3 & T4 have contact cum non-contact measurements.
- Two laser beams for easy identification of the measuring area
- Pistol design with audible alarm function, beeps when range is exceeded or underrun.
DOWNLOAD PDF FILE